Analytics · 5 min read
Analytics: track how your posted slideshows perform
Link a post, enter its numbers whenever you check them, and watch the history build up per account.
How the numbers get in
Fyslide does not scrape TikTok or Instagram and cannot read your view counts on its own. You enter the numbers yourself whenever you check a post; Fyslide keeps every reading and draws the history. That keeps your account safe.
1. Post your slideshow
Export it (Export guide) and upload it to TikTok or Instagram yourself.
2. Link the post
Open Analytics and click Link a post, or choose Link to post in a slideshow card’s menu. Paste the link of the post itself, not of your profile, for example https://www.tiktok.com/@name/photo/123 or https://www.instagram.com/p/ABC123/. Optionally answer Which slideshow is this?; that slideshow is marked as published.
3. Know what Fyslide reads
From TikTok it asks TikTok’s public oEmbed endpoint for the author, title and cover, and nothing else. From Instagram it reads nothing: the link is only stored.
4. Add numbers
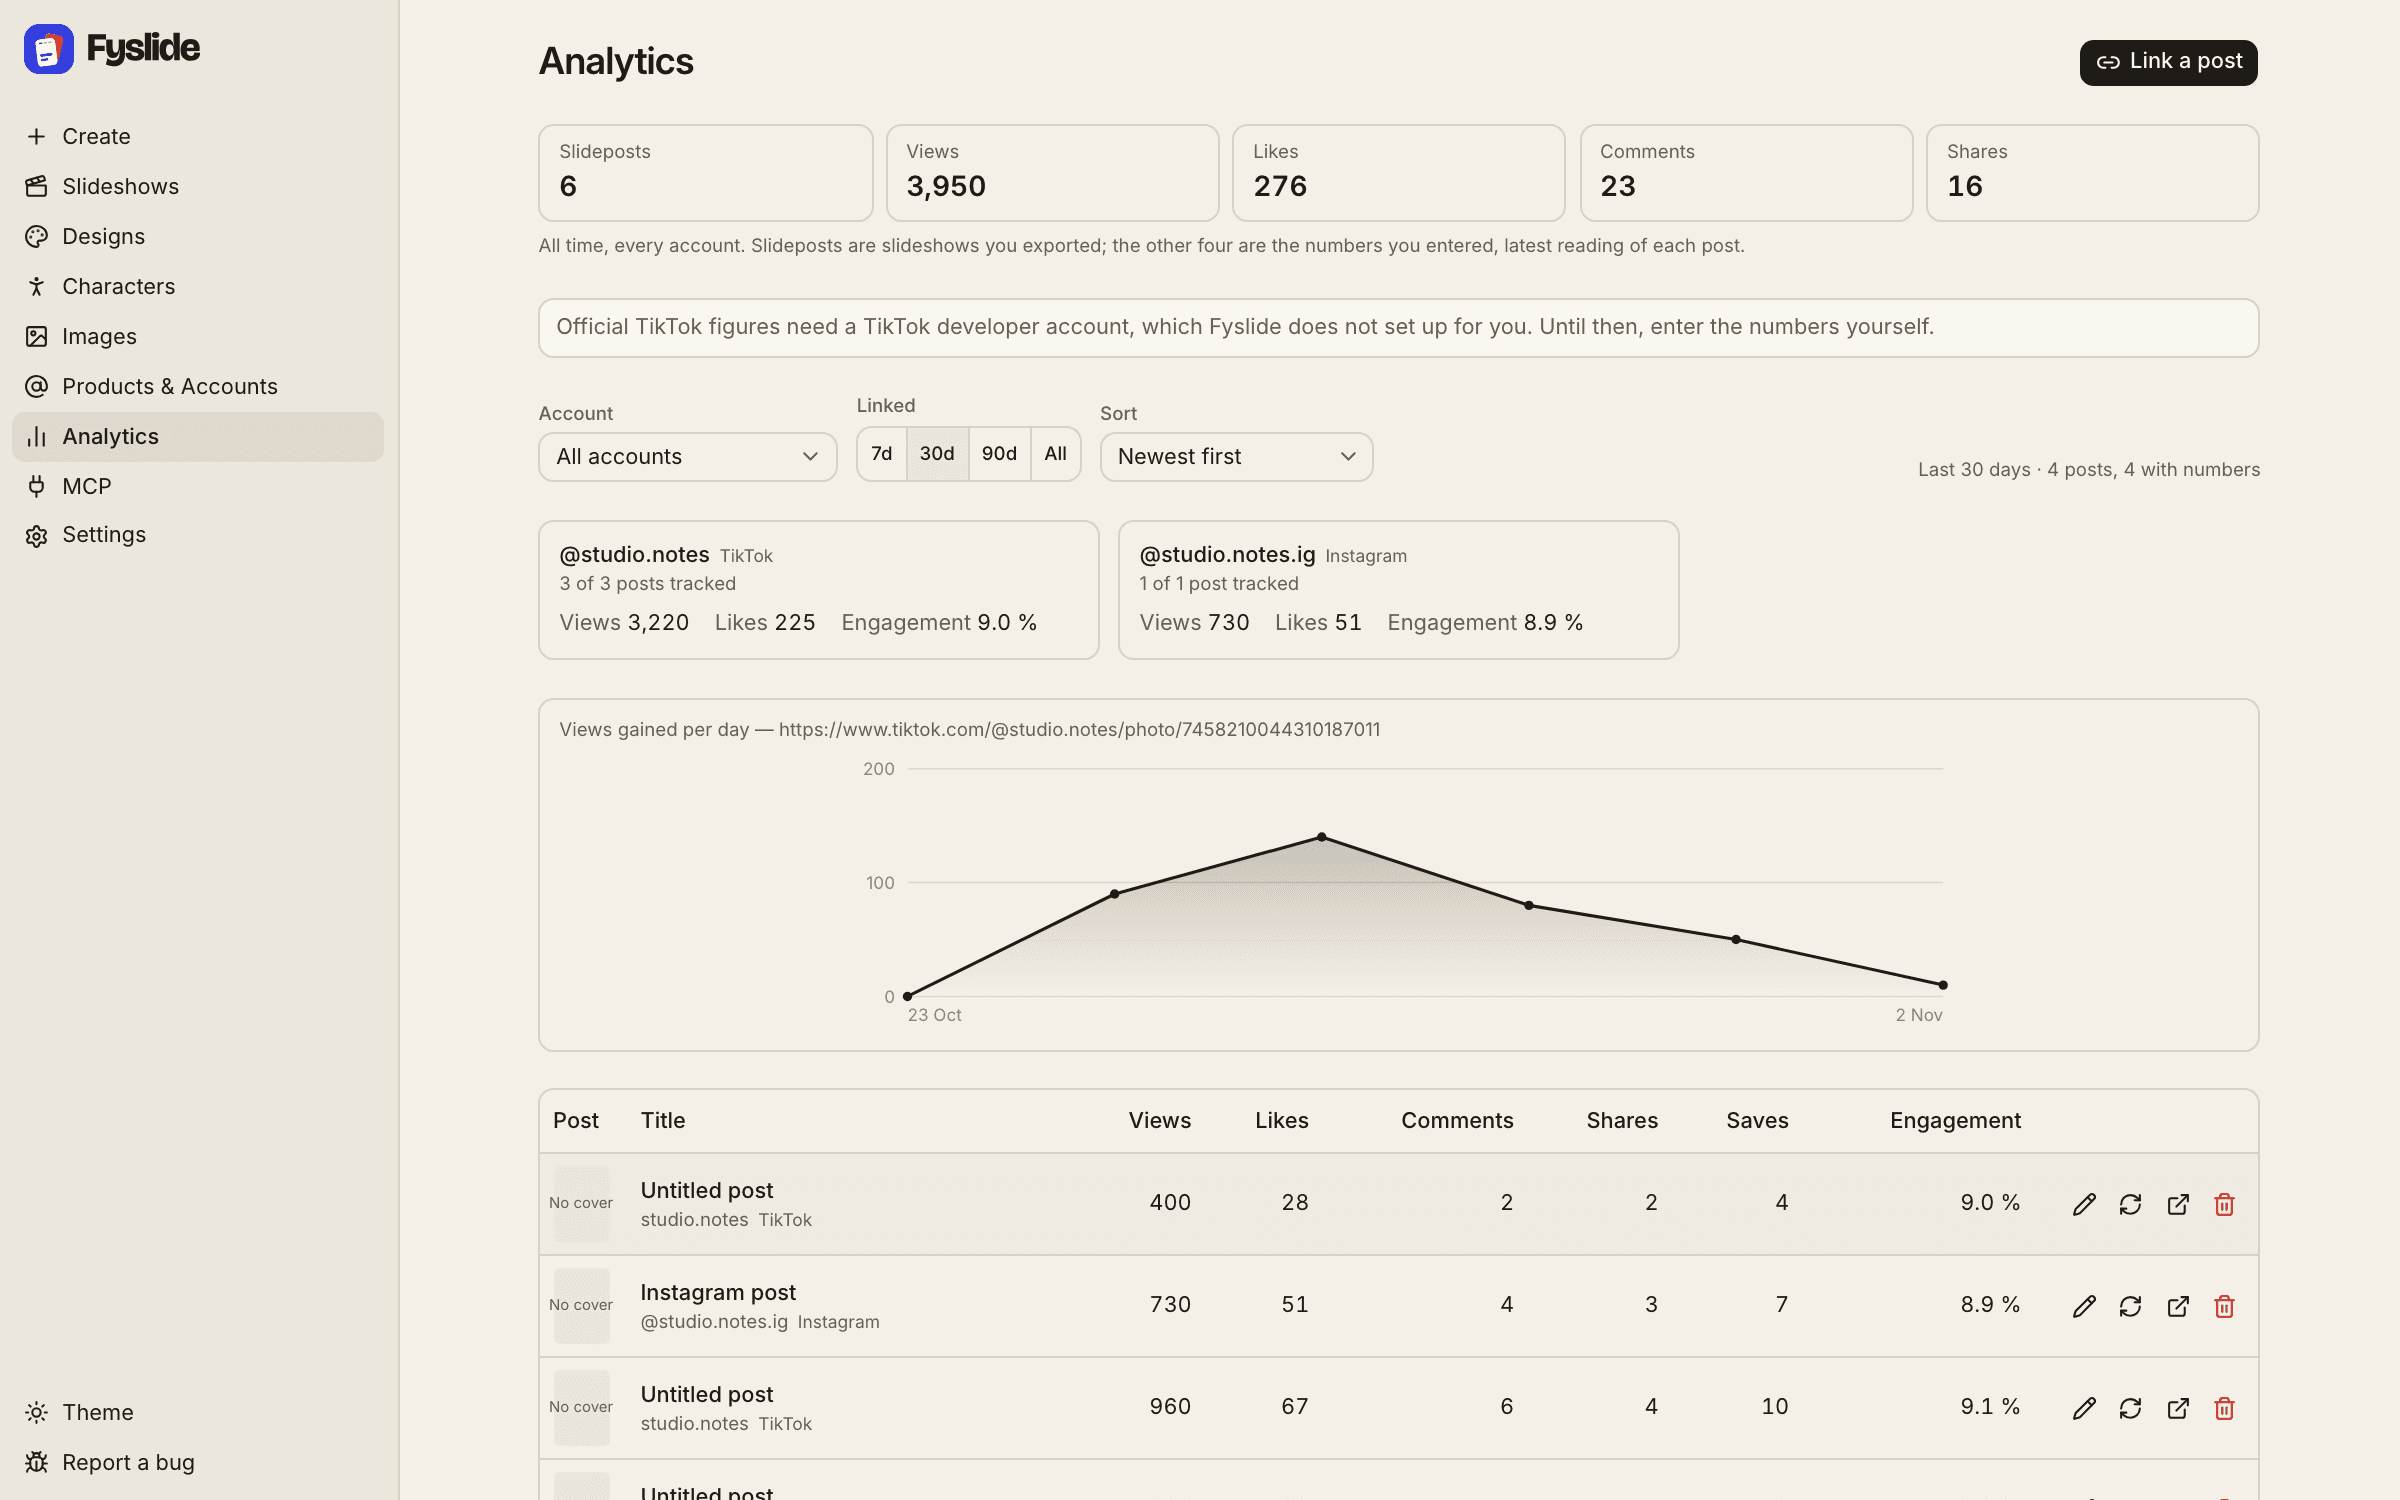
In the post’s row click Add numbers. Five boxes: Views, Likes, Comments, Shares and Saves. They start with your last reading, so usually only views change. Tab walks the boxes, Enter saves, Escape closes. A box left empty is recorded as not measured, never as 0, and numbers like “12,300” are fine.
5. Read the results
Per account you see Views, Likes and Engagement (built from likes, comments, shares and saves), a daily views chart where days without a reading are gaps, not zeros, and the list of posts. A post with no numbers reads Not tracked yet.
6. Filter and sort
Account (also All TikTok and All Instagram), Date range (last 7, 30 or 90 days, or all time) and Sort (Newest first, Most views, Most likes, Best engagement).
7. Keep it tidy
Per post: Refresh cover and author, Open on TikTok or Instagram, and Stop tracking, which leaves the slideshow and its pictures untouched.
Tips
- Enter numbers at the same rhythm (for example every Monday) so the chart compares like with like.
- Official TikTok figures need a TikTok developer account; until then manual entry is the honest way.